
Blood Test Results Explained: Understanding Your Report, Reference Ranges and Common Tests
Reviewed by: Manipal Hospitals Global
Posted on Sep 30, 2026
10 Min Read
Synopsis
Step | Component | Purpose & Clinical Context |
Step 1 | Observed Value | The exact quantitative measurement of the biomarker detected in your sample at the time of collection. |
Step 2 | Biological Reference Interval | The statistical range covers 95% of a healthy reference population. Ranges vary between laboratories depending on assay methodology and instrumentation. |
Step 3 | Units of Measurement | The reporting metric. International reports often use SI units (e.g., mmol/L, µmol/L), whereas conventional reporting uses metric mass (e.g., mg/dL, g/dL). |
What is a Complete Blood Count (CBC)?
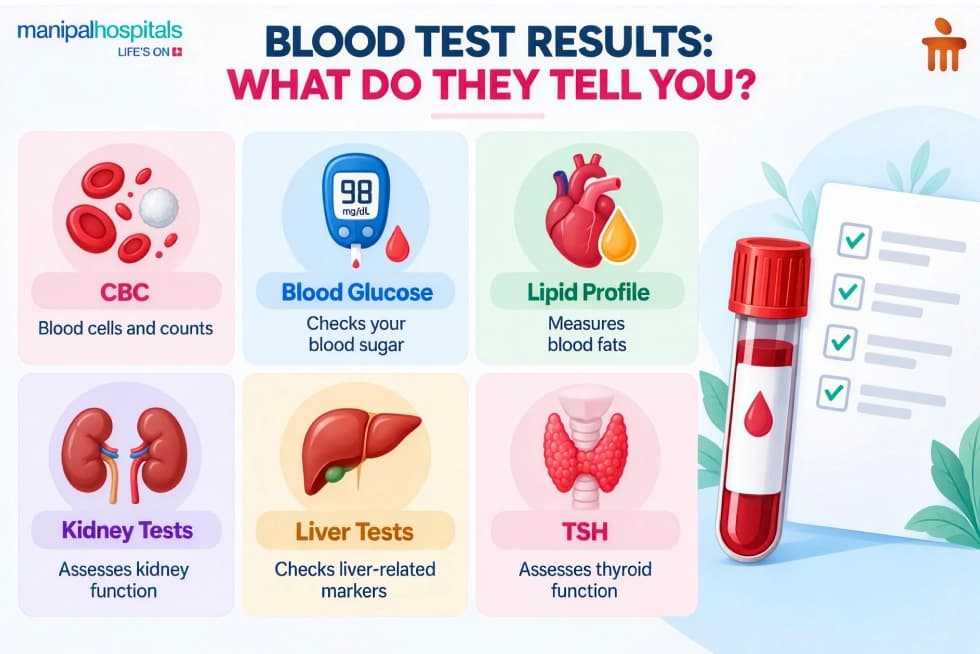
A CBC blood test is often one of the first things people notice on a blood test report because it contains several results under one heading. It looks at the three major types of blood cells:
- Red blood cells (RBCs): carry oxygen through the body. The report may also include haemoglobin, which is measured as part of a CBC, and haematocrit, which shows the percentage of blood made up of red blood cells.
- White blood cells (WBCs): are part of the immune system and help the body respond to infections and other challenges.
- Platelets: help the blood clot when there is bleeding.
You may also see MCV and RDW on the report. MCV describes the average size of your red blood cells, while RDW shows how much their size varies.
So, how do you make sense of the numbers? Start with the reference range printed beside each result. For example, multiple references from various publications give an adult WBC reference range of 4,000–11,000 per microlitre and a platelet range of 150,000–450,000 per microlitre. These are examples from that source, not universal ranges for every laboratory.
Blood Glucose Test
A blood glucose test measures the amount of glucose (sugar) in your blood when the sample is taken. It is one of the common blood tests used to check blood sugar and may be included in routine testing or ordered when a doctor wants to investigate blood glucose levels.
The result on your report will usually appear as a number followed by a unit such as mg/dL (milligrams per decilitre). For example, a report might show:
- Glucose: 92 mg/dL
- Glucose: 108 mg/dL
What those numbers mean depends partly on the type of glucose test and the circumstances in which the sample was taken. Some studies note that a glucose level over 100 mg/dL may indicate a risk of developing diabetes, but they also note that a high result may need to be repeated before it is considered a blood sugar problem.
So, when reading this part of your blood test results, look at the number, the unit and the interpretation or reference information provided by the laboratory.
Lipid Profile
A lipid profile can look like a list of cholesterol numbers at first glance. In fact, it measures a few different types of fats in your blood, so your blood test report may show several results under the same heading.
The main ones are:
- Total cholesterol: This is the overall cholesterol level in your blood. A result below 200 mg/dL is generally considered desirable.
- HDL cholesterol: Often called "good" cholesterol. In general, a higher HDL level is considered favourable.
- LDL cholesterol: Often called "bad" cholesterol. Higher levels can contribute to cholesterol build-up in the arteries.
- Triglycerides: These are another type of fat measured in the blood. A level below 150 mg/dL is generally considered desirable.
Most reports give these results in mg/dL. You might see, for example, total cholesterol: 190 mg/dL or triglycerides: 140 mg/dL
Kidney Function Tests
Your kidneys are often assessed through a group of blood tests, rather than one number labelled "kidney function". These results may appear as part of a broader metabolic panel on your blood test report.
A few numbers you may come across are:
- Creatinine: a waste product measured in the blood that is used as part of assessing kidney function.
- BUN: short for blood urea nitrogen. It measures the amount of nitrogen in your blood that comes from urea.
- Sodium and potassium: these electrolytes may also be included in a metabolic panel and are important measurements when looking at the body's chemical balance.
The units can differ between measurements. For example, creatinine may be reported in mg/dL, while sodium and potassium are commonly shown in mmol/L. Your report will also give a reference range beside each result.
When understanding blood test results, check the number, its unit and the range printed next to it. The individual values are read together rather than treating one result as a diagnosis of a kidney problem.
Liver Function Tests
A liver function test is usually a set of blood measurements, rather than one single test. That is why several liver-related results may appear together on a blood test report.
The main ones include:
- ALT and AST: enzymes measured in the blood that can indicate changes involving the liver.
- ALP: another enzyme that can be included when assessing liver-related changes.
- Bilirubin: a substance measured in the blood as part of assessing liver function.
- Albumin: a protein found in the blood that may be included in a broader liver or metabolic panel.
These results do different jobs. For example, ALT, AST and ALP are reported as enzyme measurements, while bilirubin and albumin represent different substances measured in the blood. Results may be reported in different units, such as U/L for enzymes.
Your report will give a reference range for each marker, so an ALT result, for example, should be read against the ALT range provided by that laboratory rather than against the range for another liver marker.
TSH Test
TSH (thyroid-stimulating hormone) is a blood test used to check thyroid function. It measures the level of TSH in your blood, which helps assess how your thyroid is functioning.
A TSH result may appear on your report as a number in mIU/L. You may see a result such as TSH: 3.2 mIU/L, followed by the reference range used by the laboratory.
What counts as a high or low result depends on that stated range. A TSH level above the laboratory's reference range can be associated with an underactive thyroid, while a level below the range can be associated with an overactive thyroid. These are broad interpretations rather than diagnoses.
When reading your blood test results, check the TSH value against the range printed on your own report. If thyroid testing includes other measurements, your doctor may consider those results alongside TSH rather than interpreting TSH alone.
Common Mistakes When Interpreting Blood Reports
Pitfall | Why It Happens | Preventive Action |
Inadequate Fasting | Consuming coffee, milk, or snacks within 8–12 hours before a metabolic or lipid draw artificially elevates triglycerides and glucose. | Fast strictly for 10–12 hours prior to scheduled fasting panels; plain water is encouraged. |
Post-Exercise Dehydration | Strenuous exercise within 24 hours can temporarily elevate serum creatinine, BUN, and AST through muscle breakdown and haemoconcentration. | Avoid intense resistance training or endurance workouts the evening prior to routine blood testing. |
Single-Value Panic | A minor variation slightly outside a statistical 95% bell curve often represents normal physiological fluctuation rather than disease. | Correlate findings with prior baseline reports and review trends over time rather than reacting to a single data point. |
Diagnostics at Manipal Hospitals Global: World-Class Accuracy and Care
When you choose Manipal Hospitals Global for your diagnostic and preventive care, you are placing your health in the hands of one of India’s most trusted healthcare networks. Across our international facilities, we combine cutting-edge technology with deep clinical expertise to deliver precise, timely, and actionable health insights.
Our multidisciplinary team of pathologists, biochemists, and clinical specialists work hand-in-hand with your primary physicians. If your blood tests reveal any physiological shifts, you have immediate access to a network of top-tier cardiologists, endocrinologists, nephrologists, and hepatologists to guide your next steps.
Conclusion
A blood test report is not something you need to decode line by line the moment you receive it. If a result catches your attention, note the value, the unit and the reference range shown beside it, and take the report to your doctor rather than trying to work out the significance from a search result. If you have questions about your blood test results, our team at Manipal Hospitals Global can help you understand what they mean and what, if anything, needs further attention.
Share this Article


Not sure what you’re looking for?
Not sure what you’re looking for?
Get in touch with our representatives for
help!
Get in touch with our
representatives for help!



